
Anyone searching for the top rated body composition scale is usually evaluating the wrong things. Star ratings, sleek app design, and Bluetooth connectivity are real features, but none of them indicate whether the device measures body composition accurately. A five-star review reflects how a scale feels to use. It says nothing about measurement validity.
The appeal is understandable. Over 1.2 million smart scales were sold in the United States in 2024 alone, and the body composition monitor market is projected to grow from roughly $1.82 billion to $3.14 billion by 2035. This is a category people are genuinely invested in, and for good reason: knowing more than one’s weight feels like knowing more about one’s health.
This article is not a product ranking. It is a clinically grounded guide to what these devices actually measure, where they fall short, and how to use their data intelligently. The core reframe is simple: home body composition scales are useful trend-tracking tools, not diagnostic instruments. Understanding that distinction changes how every number they produce should be interpreted.
What follows covers how the underlying technology works, why accuracy degrades, what the error margins mean in practice, which metrics home scales report but cannot clinically validate, and why professional assessment adds a layer of intelligence that home tracking alone cannot provide.
How Home Body Composition Scales Actually Work
Every consumer body composition scale, regardless of brand or price, uses bioelectrical impedance analysis (BIA). The scale sends a small, imperceptible electrical current through the body. Fat resists that current, while muscle and water conduct it well. The device measures the resistance and estimates body composition from that reading.
The technology is consistent across the entire category. What varies is electrode count, the frequencies used, and the proprietary prediction equations each manufacturer builds in.
Electrode count is the most meaningful difference. A 4-electrode scale reads foot-to-foot only, which means it must mathematically estimate upper-body composition from lower-body data. An 8-electrode scale reads through both hands and both feet, allowing more accurate segmental analysis. Most consumers never learn this distinction, yet it is one of the strongest predictors of a device’s accuracy.
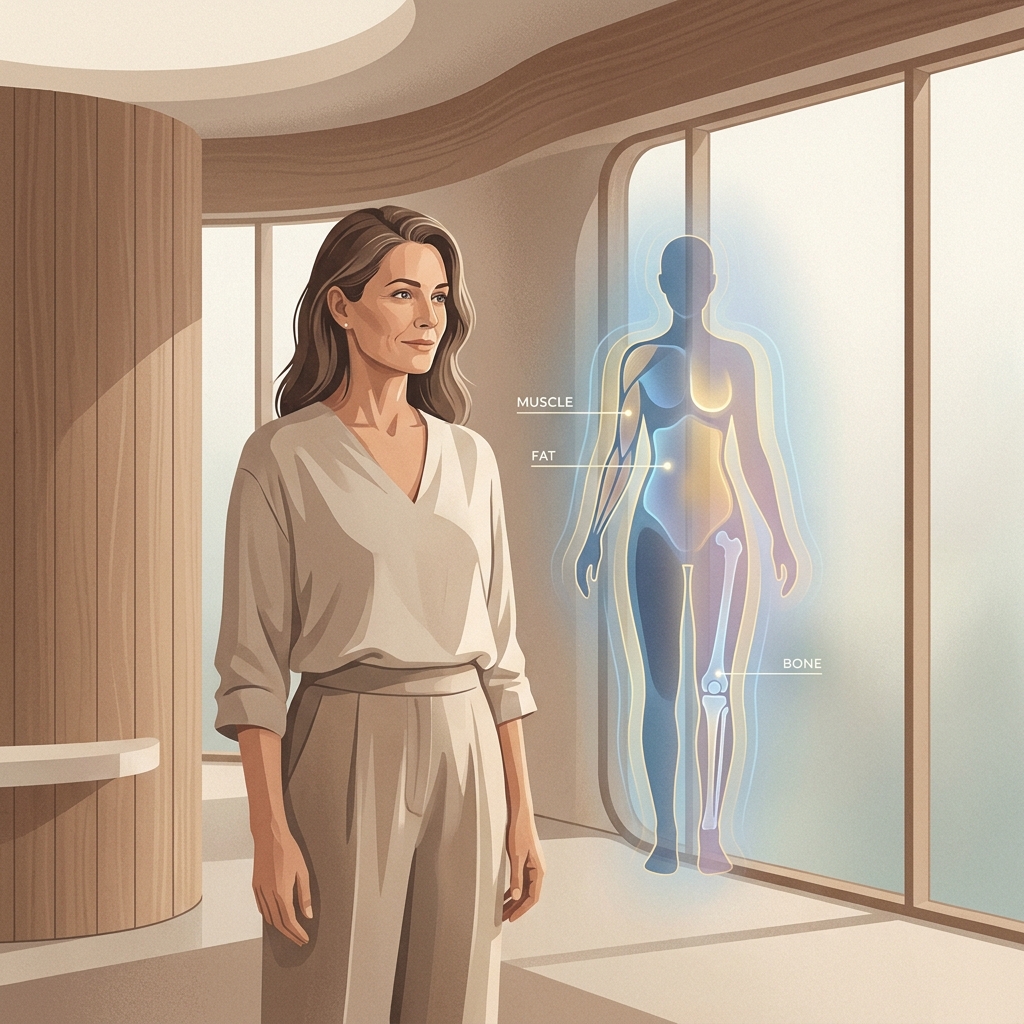
Even so, electrode count is a proxy, not a guarantee. Every home scale, including 8-electrode models, relies on prediction equations that are rarely validated independently against clinical standards. That standard is DEXA (Dual-Energy X-ray Absorptiometry), the universally recognized clinical benchmark. DEXA provides a precise breakdown of fat mass, lean mass, bone density, and regional fat distribution, including visceral fat. It is the reference against which all BIA devices are measured.
What the Research Actually Says About Smart Scale Accuracy
The most authoritative finding is blunt. A peer-reviewed study published in JMIR mHealth concluded that smart scales are not accurate for body composition and should not replace DEXA in patient care, citing significant errors in both fat mass and lean mass estimates.
The error margins matter. Home BIA scales typically carry a 3 to 8 percent accuracy error compared to DEXA. Standard 4-electrode foot-to-foot models sit at the higher end, while 8-electrode multi-frequency models come closer to 1 to 3 percent. A 2025 systematic review reinforced the concern, finding that BIA devices generally performed poorly against four-compartment model estimates of body fat and fat-free mass, with high variability across devices and populations.
Manufacturer claims deserve careful reading. One popular model was reported to achieve a 0.99 correlation with DEXA for total fat mass, but that figure came from an internal, manufacturer-funded study of only 80 participants, not independent peer-reviewed research. Independent studies tell a more cautious story.
There is genuine value here, though. Randomized studies have shown that smart scales increase self-weighing frequency and support greater weight loss over 3 to 12 months. Their behavioral value for accountability may exceed their raw measurement accuracy, and that is worth noting.
The key takeaway: “top rated” in consumer reviews reflects user experience, not measurement validity. A 4.8-star scale with a beautiful app may still carry a 6 percent body fat error margin.
Why Scale Readings Change, Even When the Body Has Not
BIA readings are highly sensitive to variables that have nothing to do with real changes in body composition.
- Hydration is the single largest confounder. Dehydration makes body fat appear artificially high; over-hydration makes it appear low. Swings of 2 to 4 percent body fat from hydration alone are documented, which is larger than the changes most people are trying to track week to week.
- Time of day shifts body water distribution. A morning fasted reading differs meaningfully from an evening reading taken after meals and activity.
- Recent exercise causes temporary fluid shifts and muscle inflammation that distort readings for hours.
- Food and alcohol alter hydration and electrolyte balance, directly changing conductivity. For those wondering whether drinking alcohol can still allow weight loss, the answer involves more than just calories.
- Menstrual cycle phase can introduce 1 to 3 percent body fat fluctuation from hormonal fluid retention, a real variable for women tracking monthly.
- Floor surface matters. Carpet, uneven floors, and inconsistent foot placement all add variability.
The practical implication is that a consistent protocol (same time of day, hydration state, and floor surface) matters more than brand or price. The trend over weeks is the signal. Any single reading is noise.
The Populations Where Home BIA Is Least Reliable
BIA prediction equations are typically built on healthy, lean-to-moderately-active adults. Accuracy degrades outside that group.
- People with obesity: higher BMI skews equations that were not designed for the altered body water distribution seen at higher body fat percentages.
- Older adults: aging changes body water and muscle quality in ways standard equations do not account for, affecting the population that arguably needs accurate data most.
- People actively losing weight: rapid change creates non-steady-state conditions, with fluid shifts and shifting water ratios that make readings unstable precisely when motivation is highest.
- People with edema or kidney disease: BIA measures resistance through body water, so any condition altering fluid balance produces unreliable results.
The irony is notable: the people most likely to be tracking health-related body composition are often those for whom home BIA is least accurate.
Metrics Scales Report, and What They Cannot Actually Measure
Modern scales report anywhere from 10 to 50 metrics. Many sound clinical. Few are.
- Body weight: measured directly and accurately. Reliable.
- Body fat percentage: estimated, not measured, from a resistance reading and a proprietary equation. Subject to every limitation described above.
- Skeletal muscle mass: estimated from fat-free mass calculations. Useful for trends, not precise enough to detect early sarcopenia.
- Visceral fat index: the most important distinction. Home scales cannot directly measure visceral fat. This figure is an algorithmic estimate. Clinical imaging (CT, MRI, or DEXA) is required for accuracy. Research places increased metabolic risk above a visceral fat area of 100 cm² and high risk above 160 cm², a level of precision no home scale can provide.
- Metabolic age: a proprietary calculation with no standardized clinical definition. It is a marketing metric.
- Bone mass: home BIA cannot measure bone density. DEXA is the gold standard. Any home figure has no diagnostic value.
The metrics that matter most clinically are exactly the ones home scales are least equipped to measure.
Why These Metrics Matter Enormously When Measured Accurately
The fact that home scales cannot measure these metrics reliably does not make the metrics unimportant. It means accurate measurement requires a different tool.
Visceral fat is metabolically active tissue surrounding the internal organs, clinically linked to cardiovascular disease, type 2 diabetes, metabolic syndrome, and cancer risk. The difference between 90 cm² and 110 cm² is meaningful, and only imaging can distinguish them. Understanding how to get rid of belly fat requires first understanding what type of fat is actually present and where it is stored.
Then there is normal weight obesity: a normal BMI with high body fat, associated with impaired metabolic health and invisible to standard scales. A 2026 analysis of 58,053 U.S. adults found that applying body fat criteria raised U.S. obesity prevalence from 43 percent (BMI-based) to 61 percent.
This aligns with the 2025 Lancet Commission, where 58 global experts formally called for moving beyond BMI, recommending that excess adiposity be confirmed by direct body fat measurement or an additional anthropometric criterion. Muscle mass matters too, as a key predictor of insulin sensitivity and longevity. Home trend data can hint at direction; clinical assessment confirms and contextualizes. Numbers without clinical context are data. Numbers with context are actionable intelligence.
The Smarter Approach: Home Tracking Plus Clinical Baseline
The most clinically sound model is a hybrid one: use professional body composition assessment to establish an accurate baseline, then use a home scale for ongoing trend monitoring.
A clinical baseline anchors understanding with validated numbers. Home data then becomes meaningful, because the starting point is accurate and changes can be interpreted in relation to actual health risk. Without that baseline, home data is purely relative. The number may have moved, but whether the starting point was accurate or what the change means for health remains unknown.
This approach is especially valuable during active weight loss or recomposition. Clinical assessment at the start, at milestones, and when data signals a significant shift gives home tracking the context it cannot generate on its own.
What to Look for in a Home Scale, and What to Ignore
For those still selecting a scale, practical guidance helps.
What matters: electrode count (8-electrode models outperform 4-electrode ones), measurement consistency (the same reading twice under identical conditions), and app quality for trend visualization.
What matters less than reviewers suggest: brand name, the number of metrics reported (more metrics do not mean more accuracy), connectivity features, and price above a moderate threshold. A well-designed mid-range 8-electrode scale used consistently outperforms an expensive 4-electrode scale used carelessly.
The single most important factor is protocol: the same time each day, morning, after using the bathroom, before eating or drinking, on the same hard floor.
For context, notable 2026 options include the Withings Body Scan (8-electrode, segmental analysis, ECG), the InBody Dial H40 (professional-grade segmental BIA), the Eufy Smart Scale P2 (often cited as best overall by reviewers), and the FITINDEX 8-electrode (dual-frequency). These are examples of the category, not validated clinical instruments. No home scale, at any price, should serve as a diagnostic tool or the sole basis for a health decision.
Conclusion: Better Data Starts With Understanding Its Limits
The most sophisticated home body composition scale on the market is still a trend-tracking tool, not a diagnostic instrument. Understanding that distinction separates informed self-monitoring from data that misleads.
The key realities bear repeating: BIA accuracy is meaningfully affected by hydration, time of day, menstrual cycle, and floor surface; error margins of 3 to 8 percent are clinically significant; visceral fat index and metabolic age are estimates, not measurements; and the people most motivated to track are often those for whom BIA is least reliable.
What home scales do well is real. They build accountability, increase self-weighing frequency, and provide trend data that, read correctly, genuinely helps. The 2025 Lancet Commission’s call to move beyond BMI reflects a broader shift toward direct body fat measurement. Home scales are part of that shift, but the clinical layer is what makes the data meaningful.
Turn Your Numbers Into a Plan
For those already tracking, already engaged, and already asking sharper questions about what their data means, clinical body composition assessment offers the next level of insight.
The goal is not to replace a home scale. It is to add the layer that turns trend data into actionable health intelligence, connecting numbers to metabolic health, muscle preservation, visceral fat risk, and a genuine clinical plan. This is where Red Mountain’s 30-plus years of clinical experience and in-person provider model matter: not an app, not an algorithm, but clinicians who interpret body composition in the context of a full metabolic picture.
For those ready to understand what their body composition numbers actually mean for long-term health, a clinical assessment is the clearest next step. This is the kind of conversation that happens every day at Red Mountain.