For decades, soldiers, veterans, and fitness-focused adults have treated the Army body fat calculator as a reliable verdict on their health. Pass the tape test, the thinking goes, and you have a clean bill of metabolic health. The reality is more complicated.
The Army body fat composition calculator was never designed to measure metabolic health with clinical precision. It was built for administrative compliance screening at scale, and that distinction matters more than most people realize.
The clearest signal of its limitations comes from the Army itself. As of July 7, 2026, the Army rescinded all body fat percentage assessment methods, including the one-site tape test, and replaced them with a waist-to-height ratio standard (WHtR below 0.550). The institution that popularized the number has now moved away from it entirely.
This article explains what the calculator actually measures mathematically, documents its peer-reviewed limitations, and describes what a complete body-composition picture requires. The goal is to inform, not to alarm.
What the Army Body Fat Composition Calculator Actually Is
The first misconception is that the calculator measures fat. It does not. Instead, it estimates body density from circumference ratios using a logarithmic regression equation, then converts that density into a body fat percentage.
The male equation traces back to a 1984 Army Body Composition Study (Vogel et al.), which used underwater weighing as the criterion measure. That equation was derived from a sample of 1,126 soldiers and produced a correlation of 0.82 with the reference method.
The measurement inputs evolved over time. The legacy multi-site method used neck and abdomen for men, and neck, waist, and hips for women. In June 2023, Army Directive 2023-11 simplified this to a one-site, abdomen-only measurement.
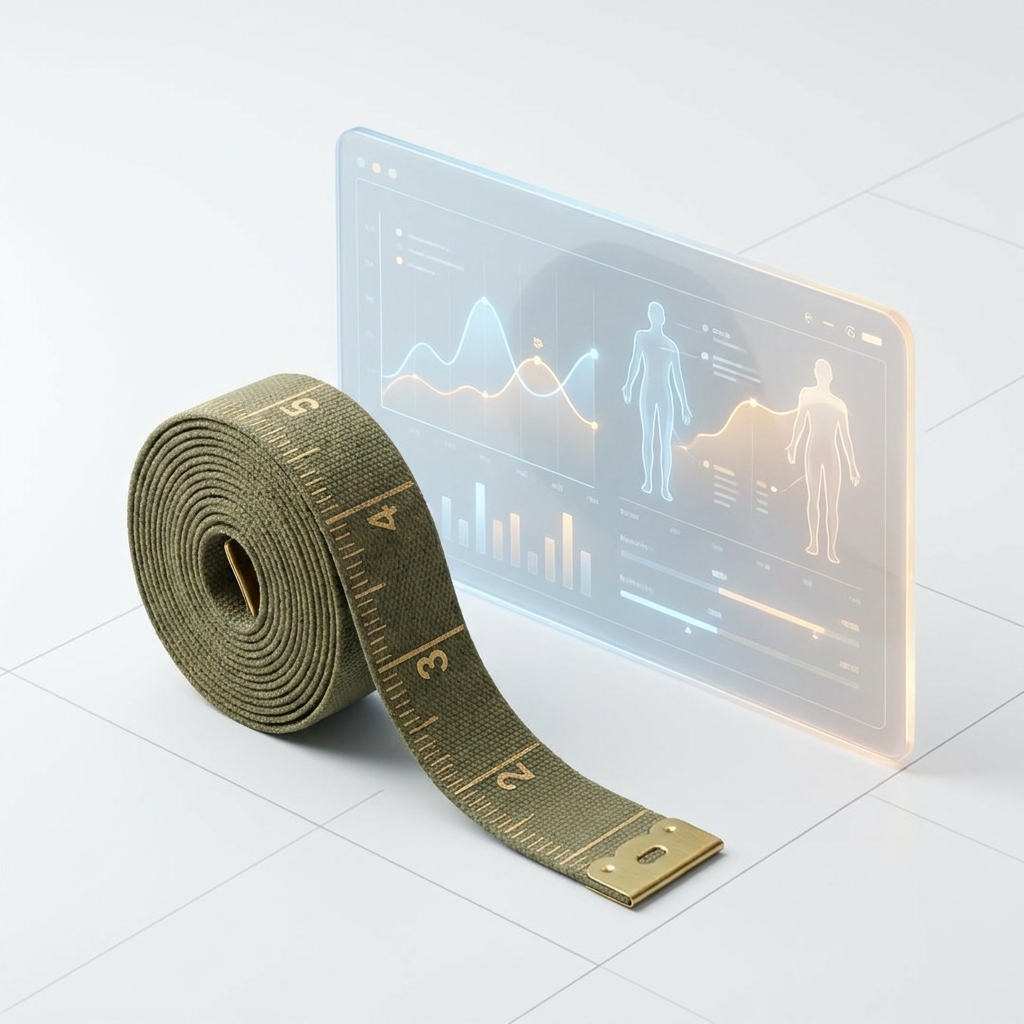
Why did the Army rely on circumference in the first place? Cost and scalability. A measuring tape costs about $5, while a DEXA scanner runs between $10,000 and $100,000. For a large-population screening tool that could be deployed anywhere, the tape was practical.
The critical point: the output is an estimate, not a clinical measurement, and the formula assumes average body proportions derived from a predominantly white male sample from the 1980s.
How the Formula Works: The Math Behind the Measurement
In plain language, the formula uses the ratio of circumference measurements (for men, abdomen minus neck) as a proxy for body density. That estimated density is then fed into the Siri equation to produce a body fat percentage.
The fundamental issue is that the formula predicts a population average. It was built on group-level data and then applied to individuals, which introduces error by design.
That error is quantified as the Standard Error of Estimate (SEE): approximately 3.52% body fat for males and 3.61% for females. In practical terms, a result of “20% body fat” could realistically fall anywhere from about 16.5% to 23.5% by DEXA standards. The original 1984 derivation carried an SEE of about 4.0%, meaning this margin has been known since the tool’s inception.
It is also worth noting what the formula does not produce. It generates a single estimated body fat percentage and nothing else: no visceral fat reading, no lean mass, no bone density, and no regional fat distribution.
The July 2026 Policy Change: Why the Army Moved On
As of July 7, 2026, the Army rescinded all body fat percentage assessment methods, including the one-site tape test, and adopted waist-to-height ratio (WHtR below 0.550) as the sole Army Body Composition Program standard.
The policy evolution tells the story. Army Directive 2023-11 (June 2023) replaced the multi-site tape test with the one-site method after a USARIEM study of 2,690 soldiers found the old test was inaccurate roughly 35% of the time.
The direction of that inaccuracy is striking. Errors ran almost exclusively in the soldier’s favor: the old test was passing approximately 35% of men and 20% of women who should have failed, while incorrectly flagging only about 1% of men and 5% of women.
The 2026 shift to WHtR reflects a broader institutional acknowledgment that circumference-based body fat estimation carries limitations the Army is no longer willing to rely on as a primary standard.
For individuals, one question outlives the policy change entirely: what does that number actually mean for metabolic health? For veterans, fitness-focused adults, and anyone who has ever used the formula, that question remains very much open.
What the Research Says: Documented Clinical Limitations
The limitations below are not opinion. They are documented in peer-reviewed military and clinical journals.
Underestimation Bias: The Calculator Consistently Reads Low
A 2023 USARIEM study in Frontiers in Physiology found that circumference-based methods underestimated body fat by a mean of -6.0% (±4.4%) for women and -6.0% (±3.5%) for men compared to DXA at baseline.
A 2025 Walter Reed NMMC study in Military Medicine (Combest et al.) found only moderate correlation between the circumference method and DEXA (males r = 0.62; females r = 0.73), with limits of agreement spanning nearly 25 percentage points.
The practical consequence: systematic underestimation means people can believe they are in a healthier range than they actually are.
Failure to Detect Change: The Calculator Can Miss Real Progress or Decline
The same 2023 USARIEM study found the circumference method detected zero body fat change in women during eight weeks of Basic Combat Training, while DXA detected a -4.0% reduction.
If the tool cannot register a meaningful change during intensive military training, it cannot reliably track progress or regression in any fitness or weight-management program. Anyone using it as a progress tracker may be making training and nutrition decisions based on a measurement that is statistically insensitive to real change.
Inter-Rater Reliability: Human Error Built Into the Method
The method’s accuracy depends entirely on the person taking the measurement. Sources of error include tape tension, body posture, breathing phase (inhale versus exhale), rater experience, and tape placement consistency.
Hydration status can also artificially improve results, since dehydration can slightly reduce circumference. The 2025 Military Medicine study explicitly noted that “accuracy and reliability are based on the skill and experience of the rater.” By contrast, DEXA is a standardized imaging technology with a precision error of roughly ±1 to 2% that does not vary by operator.
Population Bias: The Formula Was Not Built for Everyone
The equations were derived from a predominantly white male sample in the 1980s, a narrow base for a formula applied across a diverse modern population.
The structure favors certain body types: a large neck reduces calculated body fat, benefiting thick-necked individuals regardless of actual fat, while those with abdominal muscle bulk may be penalized. For women, abdominal girth alone is a poor predictor because excess fat accrues in estrogen-dependent sites (hips, triceps, thighs, and breasts) that the formula ignores. Various ethnic groups have also noted that the tape test does not fairly assess a diverse population.
The Deeper Problem: What the Calculator Cannot See
Even a perfectly accurate circumference-based percentage would still miss the most clinically important information. Body fat percentage collapses all fat into one number. It cannot indicate where that fat sits or what it is doing metabolically.
Visceral Fat: The Metabolically Active Fat the Tape Test Cannot Detect
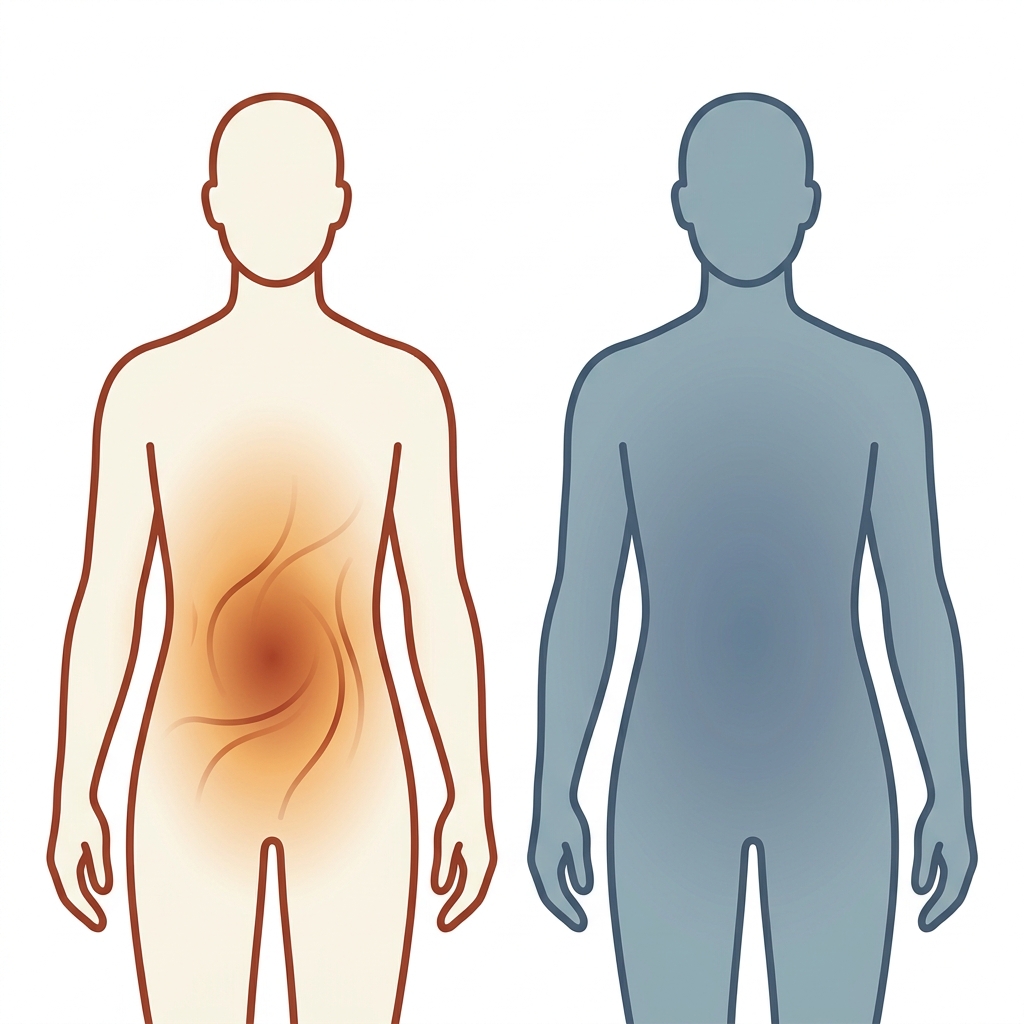
Subcutaneous fat sits beneath the skin, and the tape test roughly proxies it via circumference. Visceral adipose tissue (VAT) surrounds internal organs in the abdominal cavity and behaves very differently.
VAT is more metabolically active and pro-inflammatory, secreting higher levels of adipokines and cytokines (including IL-6 and TNF-α) that contribute to insulin resistance, systemic inflammation, and endothelial dysfunction. VAT above 100 to 110 cm² is associated with increased metabolic risk; above 160 cm² indicates high risk for cardiovascular disease, type 2 diabetes, and liver conditions.
The tape test cannot identify these thresholds. Two people with identical waist measurements and identical tape-test percentages can carry dramatically different VAT loads and dramatically different risk profiles. Research on military pilots confirms that waist circumference does not distinguish subcutaneous from visceral fat.
Lean Mass and Muscle Quality: The Other Half of the Picture
Body fat percentage reveals nothing about how much muscle or bone a person carries, only the ratio of fat to total weight. This creates the possibility of sarcopenic obesity: passing a body fat test while carrying low muscle mass and high fat mass.
A 2026 Journal of the Endocrine Society study found that 62.4% of patients with sarcopenia were classified as obese by body fat percentage alone, supporting fat mass index (FMI) as a more appropriate metric. The tape test offers no reading on appendicular lean mass index (ALMI), muscle quality, or bone density. As muscle naturally declines with age, a passing result can mask a worsening trajectory.
Body composition exercises that protect muscle become especially important in this context, since maintaining lean mass is a key factor the tape test cannot account for.
The “Metabolically Obese Normal Weight” Problem
Some individuals pass height/weight screening and the tape test yet carry disproportionate body fat, elevated visceral adiposity, and reduced muscle mass. A March 2025 Army Times opinion piece argued that a growing number of soldiers fall into this category, a risk the screening system cannot detect. With half of U.S. adults projected to be obese by 2030, the gap between administrative screening and clinical assessment grows more consequential.
What a Complete Body-Composition Assessment Actually Measures
A clinically meaningful assessment looks quite different from a tape test. The following is provided for education, not as a product pitch.
DEXA: The Clinical Standard for Body Composition
DEXA (dual-energy X-ray absorptiometry) measures total body fat percentage, fat mass index, VAT area, appendicular lean mass index, bone mineral density, and regional fat and muscle distribution. Its precision error is roughly ±1 to 2%, compared with ±3 to 4% for circumference methods.
DEXA-derived VAT correlates highly with CT scan measurements (r = 0.93), making it the most practical clinical tool for visceral fat risk assessment. Soldiers who fail the tape test can request supplemental assessment via DEXA, BIA (InBody 770), or Air-Displacement Plethysmography (BodPod) at Armed Forces Wellness Centers or H2F facilities. The honest caveat: cost drove the Army to retain the tape, but for clinical purposes, imprecision is not something to accept.
The Metrics That Matter: Beyond a Single Percentage
- Fat mass index (FMI): fat mass divided by height squared, isolating fat independent of muscle.
- Appendicular lean mass index (ALMI): muscle in the arms and legs relative to height, used to assess sarcopenia risk.
- VAT area (cm²): the visceral measurement that predicts metabolic syndrome, insulin resistance, and liver disease.
- Bone mineral density: invisible to circumference methods, yet critical as people age. Exercise can help preserve bone health while on GLP-1s, making it a relevant consideration for anyone undergoing body-composition interventions.
- Regional distribution: whether fat concentrates in the trunk versus the limbs, and whether lean mass is preserved.
What This Means for Soldiers, Veterans, and Fitness-Focused Adults
For those who have used the Army calculator, the honest read is as follows. For active-duty soldiers, a passing result (or a passing WHtR under the 2026 standard) confirms administrative compliance, not metabolic health. For veterans, habits formed around the tape test may not serve long-term health as muscle declines and visceral fat accumulates. For fitness-focused adults, the ±3.5% error, underestimation bias, and inability to distinguish fat type mean the number is a rough population-level estimate.
A passing number confirms that circumference measurements fall within a range the Army once associated with acceptable composition for a 1980s soldier population. It says nothing about visceral fat, lean mass, bone density, or metabolic risk. For anyone serious about long-term health, understanding those metrics is the real starting point. A broader metabolic health guide can help frame what a complete picture of metabolic wellness actually involves.
How Red Mountain Approaches Body Composition Assessment
Where administrative screening produces a compliance number, a clinically led practice asks a different question: what is actually happening inside the body, and why?
At Red Mountain, body-composition assessment is not a standalone measurement. It is the foundation of a broader metabolic health evaluation, designed to understand why the body is behaving the way it is and what interventions are appropriate. That work spans correcting root metabolic problems, restoring how the body functions, and protecting results over the long term.
The difference is clinical depth: more than 30 years of real-world patient outcomes, in-person providers, and longitudinal data, rather than an app-based estimate or a one-time scan without context. Red Mountain’s programs are also built to support muscle preservation and nutrient balance alongside body-composition change, directly addressing the sarcopenic obesity risk the tape test cannot detect.
For those who want to understand what their body-composition picture actually looks like, a consultation is the appropriate next step: not a sales close, but an invitation to get real answers.
Conclusion: A Passing Grade Is Not a Clean Bill of Health
The Army body fat composition calculator is a low-cost administrative screening tool built on 1980s population data. It carries a standard error wide enough to misclassify individuals, a systematic underestimation bias, and a complete inability to measure the variables that predict long-term risk: visceral fat, lean mass, and bone density.
To be fair, it is effective at what it was designed for. As a scalable, inexpensive field screen for large populations, it is better than no measurement at all, which is exactly why the Army used it for decades.
Administrative compliance and clinical metabolic health are different things. The Army has now moved to WHtR, acknowledging the tool’s limits at an institutional level. The question for individuals is whether they hold themselves to an administrative standard or a clinical one.
Understanding what the body is actually doing (visceral fat load, lean mass, bone density, and regional distribution) is the foundation of sustainable health management. For those who have relied on the Army calculator as a primary benchmark and want to see the complete picture, a clinical consultation is the appropriate next step. It is the conversation Red Mountain has been having with patients for more than 30 years.