
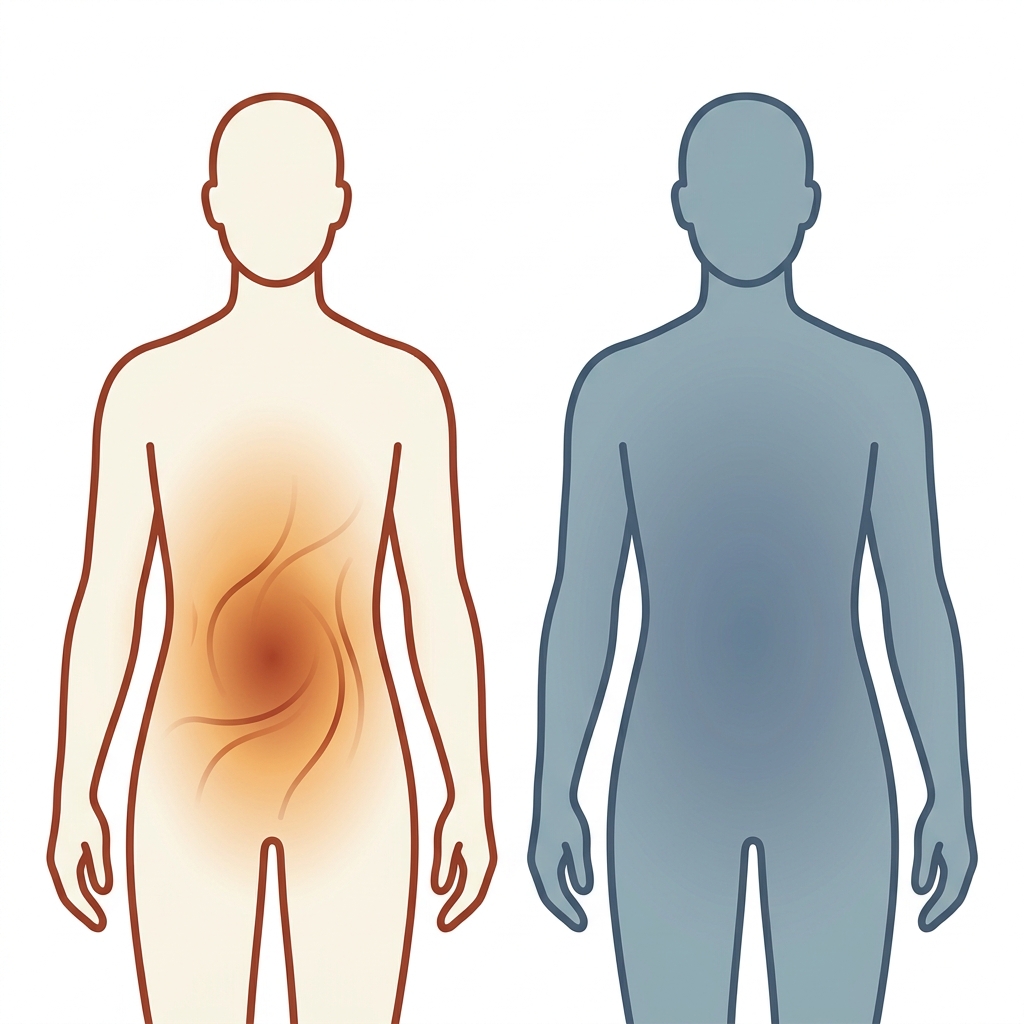
Picture two people standing on the same scale. Both weigh 180 pounds. Both have an identical BMI. On paper, medicine has historically treated them as clinically equivalent. Yet one is metabolically healthy, with strong muscle, low internal fat, and unremarkable labs. The other carries dangerous fat around the organs, has quietly rising insulin resistance, and sits at real cardiovascular risk. The scale cannot tell them apart. Neither can BMI.
This is the central problem with weight-only thinking. Body composition, meaning what the body is actually made of, is a fundamentally different and more clinically meaningful measurement than weight or BMI alone. In January 2025, this understanding moved from the margins to the center of medicine: the Lancet Diabetes & Endocrinology Commission, endorsed by more than 75 global medical organizations, formally reclassified obesity to require a direct body fat measure, not just a number on a scale.
This article walks through five real-world clinical profiles, each grounded in measurable outcomes such as cardiovascular risk, insulin resistance, and inflammatory markers, rather than appearance or clothing size. For anyone frustrated by scale-only metrics, these profiles offer a framework for understanding real metabolic health.
What Body Composition Actually Measures (Beyond Fat vs. Lean)
Body composition is the proportional breakdown of the body into fat mass, lean (fat-free) mass (muscle, bone, organs, and water), and, critically, visceral adipose tissue (VAT) as a distinct, high-risk component.
Most popular content uses a simple two-compartment model: fat versus lean. That model is incomplete because it ignores where fat is stored, which is the variable that most directly determines metabolic risk. Visceral fat is stored around the internal organs and is sometimes called “active fat” because it releases inflammatory cytokines and free fatty acids that directly impair insulin signaling. This differs significantly from subcutaneous fat, stored just under the skin, which is far less metabolically dangerous. Neither type is visible on a scale.
This is why BMI fails as a clinical tool. It cannot distinguish fat from muscle, cannot locate fat stores, and creates misclassifications in both directions: healthy people labeled “overweight” and at-risk people labeled “normal.” The 2025 Lancet Commission responded by introducing two new categories: Preclinical Obesity (excess adiposity without organ dysfunction) and Clinical Obesity (excess adiposity with measurable organ or tissue impairment). Both require body composition data, not BMI alone.
The research momentum is striking. As of 2025, more than 98,000 PubMed publications address human body composition, published at a rate of over 4,700 per year, reflecting how central this field has become to modern medicine.
The Five Clinical Profiles: Same Scale, Different Health
The following five profiles illustrate why identical scale weights can represent radically different metabolic health pictures. These are clinical archetypes drawn from published research, not individual case studies. Each is anchored in specific, measurable outcomes rather than appearance, BMI category, or clothing size.
Profile 1: The Metabolically Obese Athlete — High BMI, High Muscle, Low Risk
Consider a competitive rower or strength athlete whose BMI lands in the “overweight” or even “obese” range. The clinical picture, however, is reassuring: high lean mass, low visceral fat, normal fasting glucose, normal insulin sensitivity, low inflammatory markers (hs-CRP), and a favorable lipid profile.
BMI misclassifies this person because it cannot distinguish the weight of muscle from the weight of fat. A 220-pound athlete and a 220-pound sedentary individual with high visceral fat receive the same classification. This is precisely the error the 2025 Lancet reclassification was designed to correct. The key takeaway: high scale weight is not inherently dangerous. Composition, specifically the ratio of lean to fat mass and the location of fat, determines risk. Patients told they are “overweight” by BMI alone may be receiving inaccurate guidance.
Profile 2: The “Skinny Fat” Professional — Normal BMI, High Visceral Fat, Hidden Risk
This person has a normal BMI and appears lean but carries a high percentage of body fat and low muscle mass. The clinical term is Normal Weight Obesity (NWO), also called Metabolically Obese Normal Weight, or simply “skinny fat.” Roughly 30 million Americans fit this profile.
The risk is real and measurable. A 2025 study using NHANES data found that adults with normal BMI but high body fat percentage had over threefold increased odds of elevated hs-CRP, a key cardiovascular inflammation marker. NWO is associated with a fourfold increased risk of cardiac and metabolic disease, yet remains undiagnosed when only BMI is used. A “healthy” BMI is not a clean bill of health.
This profile is especially relevant for women in perimenopause and menopause who report that their body “changed despite doing everything right.” A shift in fat distribution toward visceral stores is a well-documented hormonal consequence. Understanding how to reverse menopausal weight gain can be an important step for women navigating these changes.
Profile 3: The Sarcopenic Older Adult — Low Muscle, High Fat, Compounding Risk
In this profile, scale weight may look stable or even low, but decades of muscle loss have been quietly replaced by fat, a condition called sarcopenic obesity. Lean muscle mass declines roughly 3 to 8 percent per decade after age 30. At a stable weight, fat progressively replaces muscle, a shift the scale cannot detect.
Sarcopenic obesity is associated with frailty, fractures, cardiovascular disease, cancer, increased hospitalization, and elevated mortality risk. Someone who has “always been thin” may carry very low muscle and high fat, a profile that looks unremarkable on a scale but represents serious functional risk. Only direct assessment can identify it. The lesson: maintaining muscle across the lifespan is not a fitness goal; it is a metabolic health imperative.
Profile 4: The High-Visceral-Fat Individual at Normal Weight — The Most Dangerous Invisible Profile
This profile presents at normal or even low body weight but carries a disproportionately high amount of visceral fat around the organs, without the external appearance of obesity. Unlike Profile 2, which emphasizes overall high body fat, this profile highlights VAT specifically as the primary risk driver.
Visceral fat is metabolically active. It releases cytokines, free fatty acids, and hormones that impair insulin sensitivity, elevate triglycerides, raise LDL, and increase cardiovascular risk even without obesity by any standard measure. A 2025 Frontiers in Endocrinology study confirmed visceral fat area, measured by CT, as a quantifiable cardiovascular risk factor in type 2 diabetes, regardless of total body weight. VAT accumulation is tied to sedentary behavior, refined-carbohydrate intake, chronic stress, poor sleep, and hormonal change, and is not predicted by the scale. This profile most powerfully demonstrates why body composition is a medical necessity, not a fitness metric.
Profile 5: The Lean, Metabolically Healthy Person — What Optimal Actually Looks Like
This profile combines low body fat (within healthy ranges for age and sex), high lean muscle, low visceral fat, and favorable markers across the board: normal fasting glucose, normal insulin sensitivity, low hs-CRP, and healthy lipids and blood pressure.
As a benchmark, healthy body fat for men aged 20 to 39 runs roughly 8 to 19 percent; for women in the same range, roughly 21 to 32 percent. These figures rise with age. A large cohort study of 190,599 participants found that increasing lean body mass significantly decreased the risk of metabolic syndrome (adjusted odds ratio around 0.78 to 0.80), while increasing fat mass raised it. This profile is not defined by a number on the scale but by the ratio of lean to fat, the absence of excess visceral fat, and functional muscle. It is also the profile most easily undermined by weight-loss approaches that sacrifice muscle.
Why These Profiles Matter: The Clinical Outcomes Behind the Numbers
Taken together, these profiles make a single argument: body composition determines metabolic outcomes in ways scale weight and BMI cannot. Profiles 2 and 4 map to cardiovascular and insulin resistance risk. Profile 3 maps to frailty and functional decline. Profiles 2, 3, and 4 all carry metabolic syndrome risk, while Profiles 1 and 5 represent metabolic protection.
The common threads are measurable. Elevated hs-CRP quantifies the systemic inflammation that visceral fat drives, and it can be high in people with normal BMI. Visceral fat’s release of free fatty acids directly impairs insulin signaling, creating a pathway from composition to disease that operates independently of weight. The defining question in metabolic medicine has shifted from “what does the scale say?” to “what is the body made of?” That distinction separates a clinician who says “your weight is fine” from one who identifies a risk profile before it becomes a disease.
How Body Composition Is Actually Measured: Clinical Methods That Matter
Consumer scales and BMI provide no body composition data. Identifying these profiles requires clinical-grade measurement.
- DEXA (Dual-Energy X-ray Absorptiometry): the clinical gold standard, with accuracy of ±1 to 2 percent. It provides regional breakdowns of fat, lean mass, and bone density, and can quantify visceral fat.
- BIA (Bioelectrical Impedance Analysis): a practical clinical alternative at ±3 to 5 percent accuracy. Non-invasive and fast, it is well-suited to frequent longitudinal tracking and is the method most commonly used in clinical metabolic programs.
- CT-based analysis at the L3 vertebral level: an emerging tool where AI can now quantify skeletal muscle index, visceral fat, and myosteatosis in seconds, with these metrics consistently outperforming BMI in oncology, cardiology, and critical care.
A single scan is a snapshot. Serial measurements over time reveal whether a person is losing fat, preserving muscle, or drifting toward the dangerous shifts seen in Profiles 3 and 4. In a clinical program, body composition measurement is the primary tool for understanding whether an intervention is working and for what.
Body Composition and GLP-1 Medications: Why Tracking What You Lose Matters
GLP-1 medications are now widely prescribed for weight loss, and body composition monitoring during treatment is clinically essential, not optional. A 2025 review found that a meaningful portion of the total weight lost in GLP-1 and GLP-1/GIP receptor agonist trials came from lean soft tissue rather than fat. In other words, some weight lost can come from muscle, not just fat.
The SEMALEAN study (2025 to 2026, n=115) illustrated the pattern clearly: fat mass decreased substantially over 12 months, while lean mass initially declined before stabilizing. This is why tracking composition, not just scale weight, matters during pharmacological weight loss. Losing muscle without monitoring can push someone from Profile 1 or 5 toward sarcopenic obesity, or worsen an existing normal-weight obesity presentation. The scale would show “progress” while the metabolic picture quietly deteriorates.
The Obesity Action Coalition’s “fat-free mass rule” offers a useful threshold: for healthy weight loss, only a limited share of weight lost should come from fat-free mass rather than fat. Body composition monitoring is the only way to verify that threshold is being met.
This is where clinical structure matters. Red Mountain treats a GLP-1 medication as one tool within a broader program, supported by monitoring designed to help preserve muscle mass and maintain nutrient balance. Learn more about how GLP Elite can help achieve your wellness goals within a medically supervised framework. A serious metabolic program tracks what is actually being lost, not just how many pounds. That standard separates medically supervised care from a scale-based approach.
Conclusion: The Question Is No Longer What You Weigh — It’s What You’re Made Of
The five profiles demonstrate that scale weight is a dangerously incomplete metric. Two people at identical weights can have radically different metabolic health pictures, and only body composition can tell them apart. The January 2025 Lancet Commission formally elevated composition to a diagnostic requirement, and the defining clinical question is no longer “what does the scale say?” but “what is the body made of?”
Fat mass, lean mass, and visceral adipose tissue are the variables that determine risk. Any program tracking only scale weight is missing the most important data. If any profile felt familiar (the normal-weight person who “should be fine” but is not, the older adult whose weight is steady but whose strength is fading, the person on a weight-loss medication who wants to know what they are actually losing), then body composition measurement is the logical next step.
Red Mountain’s approach reflects this: more than 30 years of clinical experience, in-person oversight, and programs designed to track and protect body composition, not just move the scale.
Ready to Understand Your Own Body Composition Profile?
Most people have never had a clinical body composition assessment. A single number on a scale has been their only data point for a lifetime. An initial consultation at Red Mountain addresses exactly this gap: not just what a person weighs, but what their body is made of and what that means for their metabolic health, backed by more than 30 years of clinical experience and an in-person provider model. For those seeking that level of clarity, a consultation is the right place to start.