
The Definition of Body Composition: A Clinical Breakdown
Introduction: Why ‘Body Composition’ Needs a Real Definition
Most consumer content reduces body composition to a vague “fat versus muscle” ratio. That shorthand is convenient, but it is imprecise and clinically incomplete. This article sets out the clinical definition of body composition so that later discussions of examples, measurement tools, and comparisons with scale weight rest on firm ground.
The sections below cover the formal five-level scientific model, the terms that are often blurred (fat mass, fat-free mass, lean mass, skeletal muscle mass, and visceral versus subcutaneous fat), and the clinical conditions where this precision matters. Throughout, the article returns to one idea that guides Red Mountain’s Function and Longevity care stages: body composition, not scale weight, is the more meaningful marker of metabolic progress.
The Clinical Definition of Body Composition
At its core, body composition is the proportion of fat and non-fat (lean) tissues in the body. The primary goal of assessing it is to quantify fat percentage and lean or muscle mass.
The NIH-published editorial on clinical nutrition defines body composition analysis (BCA) as “the description and quantification of the various components that make up the human body.” WebMD offers the version most patients recognize: the percentage of fat, bone, and muscle in the body, which gives a clearer picture of physical health than weight alone.
Both definitions are accurate. The single “fat versus muscle” ratio, however, simplifies what is actually a highly structured clinical model.
The Five-Level Model: How Researchers and Clinicians Actually Define the Body
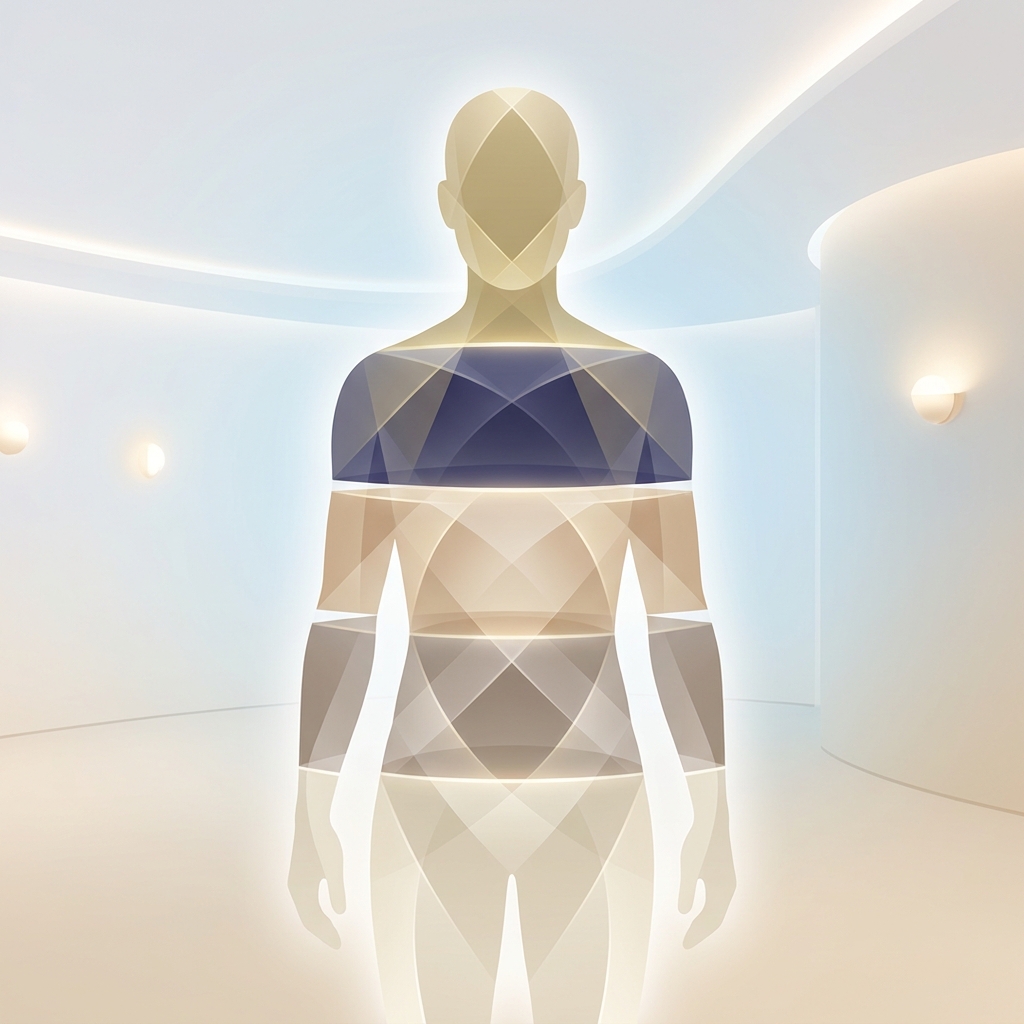
The foundational framework is the five-level model introduced by Wang and colleagues in 1992. It remains central to the field and is reaffirmed in the 2025 American Journal of Clinical Nutrition methodological standards for body composition. The organizing principle is hierarchical: each higher level contains all components of the levels below it. The same framework appears in the NIH editorial on body composition analysis.
Level 1: Atomic
This is the elemental level: oxygen, carbon, hydrogen, nitrogen, calcium, and other elements. It underpins advanced research rather than routine patient scans.
Level 2: Molecular
The molecular level is commonly described with the four-compartment model: water, protein, lipids (fat), and minerals. “Fat mass” as a formal concept is derived here, and this is the level most clinical scans, including DEXA, are designed to estimate.
Level 3: Cellular
Here the body is divided into cells, extracellular fluid, and extracellular solids. This level underlies the measurement of metabolically active tissue.
Level 4: Tissue-Organ
This level includes skeletal muscle, adipose tissue, bone, and organs. It is the most relevant to clinical practice and patient-facing reports, and it is where “skeletal muscle mass” and “adipose tissue” are formally defined.
Level 5: Whole-Body
The whole-body level covers total weight, volume, and overall shape and size. Scales and BMI stop here. Clinically, this is the least informative end of the model, which is why whole-body numbers can mask what is happening underneath.
Translating the Clinical Model Into Plain Language
A body-composition printout is essentially a molecular and tissue-organ snapshot, not a whole-body guess. In practical terms, two people can share the same weight while differing dramatically in fat mass, muscle mass, and fat distribution. This is also where consumer content, and even some clinical literature, becomes imprecise by using key terms interchangeably.
Terms That Get Blurred: A Precise Breakdown
The following definitions serve as a terminology anchor.
Fat Mass vs. Fat-Free Mass
- Fat mass (FM): the total mass of lipid in the body.
- Fat-free mass (FFM): everything that is not fat, including water, protein, minerals, and bone. It is the molecular-level complement to fat mass.
In strict clinical usage, FFM is not identical to “lean mass,” although the terms are often used loosely.
Lean Mass vs. Skeletal Muscle Mass
- Lean mass: in some models, fat-free mass plus essential fat; in others, a synonym for FFM. The literature itself is inconsistent, which is why the clarification matters.
- Skeletal muscle mass (SM): the muscle attached to bone and used for movement. It is a subset of lean mass, not the whole of it.
The distinction has clinical weight. Increases in skeletal muscle specifically are linked to improved insulin sensitivity and glucose disposal.
Visceral vs. Subcutaneous Fat
- Subcutaneous fat: fat stored directly under the skin.
- Visceral fat: fat stored around internal organs in the abdominal cavity.
Visceral fat carries distinct cardiometabolic and cancer risk implications, independent of total fat mass. Reductions in visceral fat are linked to improved blood pressure, lipids, and glycemic control. Fat location is a component of body composition itself, not an afterthought reserved for chart articles.
Essential Fat vs. Storage Fat
Essential fat is the physiologic minimum required for hormone production, organ protection, and nerve insulation, roughly 2–5% for men and 10–13% for women, with women requiring more for reproductive and hormonal function. Storage fat is everything above that minimum.
The American Council on Exercise (ACE) categories place essential fat within a broader spectrum:
| Category | Men | Women |
|---|---|---|
| Essential fat | 2–5% | 10–13% |
| Athletes | 6–13% | 14–20% |
| Fitness | 14–17% | 21–24% |
| Acceptable/Average | 18–24% | 25–31% |
| Obese | 25%+ | 32%+ |
Because a biological minimum exists, the idea that “lower is always better” for body fat is inaccurate.
Why Precise Body Composition Definitions Carry Real Clinical Stakes
Terminology precision changes how risk is identified in real patients. BMI is calculated only from weight and height, so it cannot distinguish a pound of muscle from a pound of fat. Research using DEXA-based assessment found that roughly 46.8%–52.6% of people classified as “normal” or “underweight” by BMI were still metabolically unhealthy.
Normal-Weight Obesity (the ‘Skinny-Fat’ Pattern)
Normal-weight obesity describes a normal BMI combined with high body fat and low muscle mass. It is associated with increased cardiometabolic risk despite a “healthy” classification, and it is invisible on a scale. Only body composition assessment reveals it.
Sarcopenic Obesity
Sarcopenic obesity is the coexistence of low muscle mass (sarcopenia) with excess fat mass. Reported prevalence ranges from roughly 0.1% to 85% depending on diagnostic criteria, which shows why standardized, composition-based definitions matter. A meta-analysis of 50 studies covering about 86,000 people found an 11% global prevalence in adults over 60.
Metabolically Healthy Obesity
Metabolically healthy obesity describes people classified as obese by BMI who have favorable lipid and glucose profiles, often linked to lower visceral fat and less fat in the liver and muscle. It is the mirror case of normal-weight obesity. Together, they demonstrate that weight and metabolic health are not the same measurement.
How Body Composition Is Actually Measured
Common methods, ranked roughly by accuracy and accessibility, include DEXA, bioelectrical impedance analysis (BIA), air-displacement plethysmography (Bod Pod), hydrostatic weighing, skinfold calipers, and anthropometric measures such as waist circumference and BMI.
DEXA has been the internationally accepted clinical standard since its introduction in 1987. It was originally used for bone density and is now used widely for fat and lean mass. BIA passes a small current through the body. Water-rich muscle conducts it easily, while fat impedes it, which is why hydration can skew home-scale readings. Measurement methods are covered in depth in a separate article in this series.
Why Red Mountain Defines Progress by Body Composition, Not the Scale
In Red Mountain’s Function stage, muscle preservation and body composition serve as markers of how the body is actually working. Muscle tissue is metabolically active and raises resting metabolic rate. A scale cannot distinguish fat loss from muscle loss, and calorie restriction alone often reduces both, which can lower metabolic rate and physical function even when the number looks successful. That makes skeletal muscle mass a meaningful target.
In the Longevity/Maintenance stage, body-composition tracking over time shows whether results are being protected across years, not weeks. Drawing on more than 30 years of clinical experience, Red Mountain treats structure and clinical oversight, not a single number, as the way to identify true metabolic progress and long-term health.
Conclusion: A Definition Precise Enough to Act On
Body composition is a structured, five-level clinical model, not a single fat-versus-muscle ratio. Fat mass, fat-free mass, lean mass, and skeletal muscle mass are distinct terms, as are visceral and subcutaneous fat. Identical weight or BMI can mask very different metabolic realities, as normal-weight obesity, sarcopenic obesity, and metabolically healthy obesity all show. This definition is the lens for the rest of the series and for Red Mountain’s clinical approach.
Next Step: Understanding Your Own Body Composition
Knowing where fat mass, muscle mass, and fat distribution fall is most useful when a clinician interprets the numbers in context. Related Red Mountain articles on body composition examples, measurement tools, and charts offer practical next steps. If a body-composition printout raised questions, a consult is usually the next step to understand what it means for an individual metabolic picture.