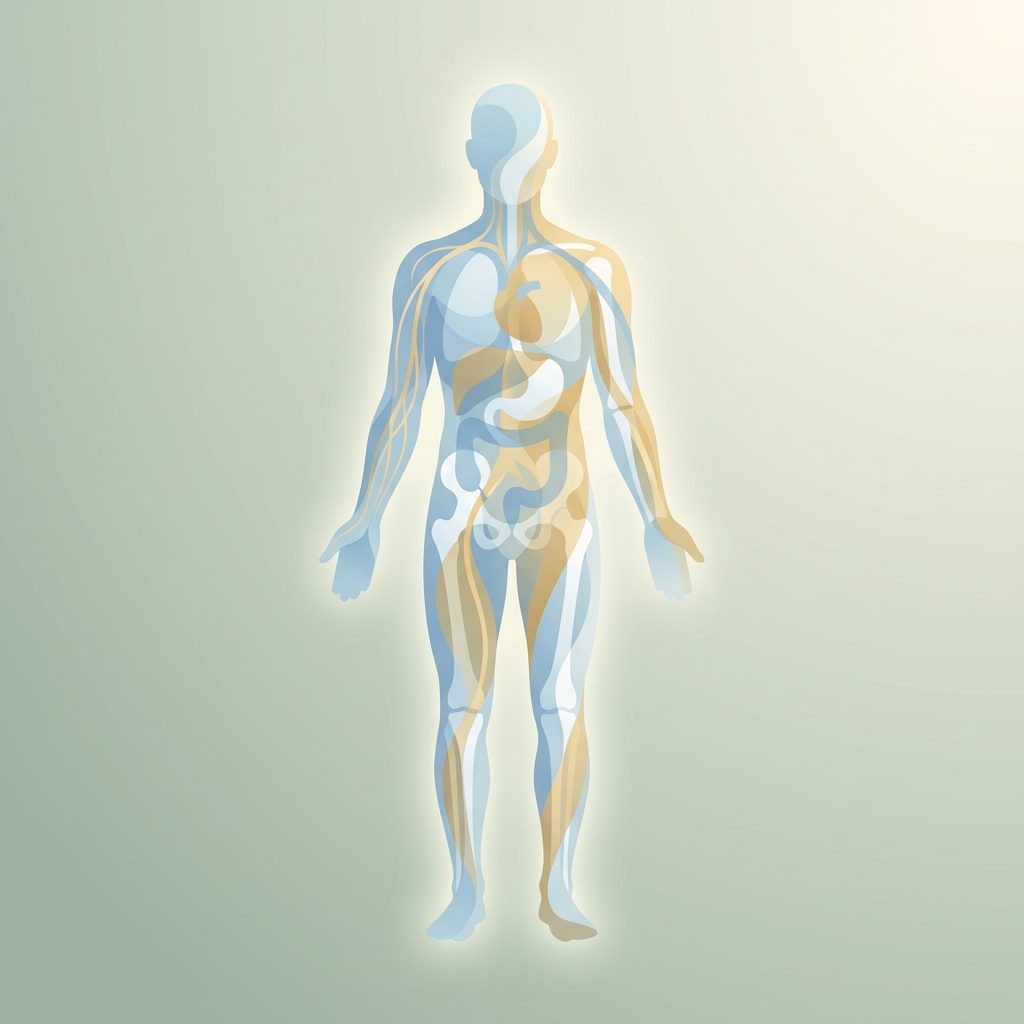
Two people can step on the same scale, read the exact same number, and yet look, feel, and function in completely different ways. One might be strong, energetic, and metabolically healthy. The other might be fatigued, insulin resistant, and quietly carrying dangerous levels of fat around their organs. The scale cannot tell them apart. Their body composition can.
Total body weight and BMI answer only one question: how much. They say nothing about what. They cannot distinguish fat from muscle, bone from water, or a metabolically resilient body from a metabolically fragile one. That distinction is the entire point of body composition.
Body composition breaks total weight into four meaningful parts: fat mass, lean mass, bone mineral content, and body water. It is the ratios between these components, not the number on the scale, that determine real metabolic risk. This article is not a surface-level definition. It is a clinician-level explanation of what body composition actually means for long-term health, delivered through the lens of a practice that has monitored it in real patients for more than 30 years: Red Mountain.
What Body Composition Actually Means
Body composition refers to the proportions of fat mass, muscle mass, bone mass, and body water that together make up total body weight. Where weight is a single aggregate number, body composition breaks that number into its metabolically meaningful parts.
Scientifically, the human body is organized into five compositional levels: atomic, molecular, cellular, organ/tissue, and whole-body. In clinical practice, most work happens at the molecular level using either a two-compartment model (fat mass versus fat-free mass) or a three-compartment model that separates fat mass, lean mass, and bone mineral content.
Terminology matters here. “Fat-free mass” (FFM), “lean body mass” (LBM), and “skeletal muscle mass” are often used interchangeably but differ clinically. FFM includes everything except fat. LBM is slightly different, and skeletal muscle is only one part of the whole. A 2025 international expert consensus published in The American Journal of Clinical Nutrition was created specifically to standardize this language, noting that PubMed now holds over 98,000 publications on body composition, growing by more than 4,700 per year. This is a mature and rapidly evolving science, as documented in the 100-year review of body composition advances published in the International Journal of Obesity.
The Four Compartments: What Your Weight Is Actually Made Of
Understanding what the scale represents means understanding what each compartment does and why its proportion matters.
Fat Mass: Not All Fat Is Created Equal
Fat mass is the total amount of adipose tissue in the body, divided into essential fat and storage fat.
Essential body fat is roughly 3% of body weight for men and 12% for women. It is the minimum required for hormone production, reproductive health, and normal physiological function. Dropping below this threshold is clinically dangerous.
Storage fat is the energy reserve beyond that minimum. It exists as subcutaneous fat (under the skin) and visceral fat, which surrounds internal organs. These two are not the same. Subcutaneous and visceral adipose tissue (VAT) differ in cellular composition, molecular structure, and endocrine function. Visceral fat is metabolically active in a harmful way, independently linked to hypertension, coronary heart disease, metabolic syndrome, type 2 diabetes, and certain cancers.
Healthy body fat ranges depend on age and sex. Per ACE/ACSM standards, men aged 20 to 39 fall between 8 and 19%, and women in the same range between 21 and 32%. These ranges widen with age. Notably, NHANES data suggest fewer than 10% of American adults fall within a “normal” body fat percentage, and an estimated 43% qualify as obese by body fat standards, a very different picture than BMI-based rates.
Lean Mass: The Engine of Your Metabolism
Lean mass, or fat-free mass, is everything in the body except fat: skeletal muscle, organs, bone mineral content, and body water. Skeletal muscle is its metabolically dominant component. At rest, the body burns approximately 110 additional calories per kilogram of muscle, making lean mass a primary driver of resting metabolic rate.
This matters enormously with age. Lean muscle mass can decrease by nearly 50% between ages 20 and 90. Lean body mass has been described as a superior index to total body weight for prescribing medications and assessing metabolic disorders, because body fat is far less metabolically active than lean tissue.
The clinical nuance is this: losing weight without preserving lean mass can worsen metabolic health even as the scale improves. A 2026 study in Frontiers in Endocrinology confirmed that preserving fat-free mass during weight loss is critical for preventing sarcopenia and maintaining metabolic health.
Bone Mineral Content: The Structural Foundation
Bone mineral content (BMC) is the mineral mass stored in bone tissue, the structural scaffold of the body. It matters in body composition because it affects total weight independent of fat or muscle, and because low bone density (osteopenia, osteoporosis) is a hidden risk that BMI and scale weight completely obscure.
DXA (dual-energy X-ray absorptiometry) separates bone mineral content from lean and fat mass, one reason it is emerging as the gold standard for evaluation. Bone is also linked to muscle: contraction stimulates bone remodeling, so sarcopenia and osteoporosis frequently co-occur in aging adults. Bone is the least variable compartment in most weight-management contexts, but a complete picture requires it.
Body Water: The Most Overlooked Compartment
Total body water (TBW) is the fluid inside cells (intracellular) and surrounding them (extracellular). It makes up roughly 60% of an average adult male’s weight and 55% of an average adult female’s. Because muscle tissue is approximately 79% water while fat is only about 10%, hydration status is a direct reflection of lean mass quality.
Clinically, this explains why the scale is unreliable day to day: shifts in body water can cause significant short-term weight fluctuations with nothing to do with fat. Intracellular versus extracellular water balance is also an indicator of cellular health, with abnormal ratios signaling inflammation, malnutrition, or disease. Most consumer content ignores water entirely, yet it is a distinct fourth compartment with real clinical meaning.
Why BMI Is Metabolically Blind
BMI is a mathematical ratio of weight to height squared, a population-level screening tool developed in the 19th century. It is not a clinical measure of body composition. It cannot distinguish fat from muscle, bone, or fluid. Two people with identical BMIs can carry radically different metabolic risk.
A 2025 paper in the Diabetes & Metabolism Journal stated plainly that BMI “does not differentiate between fat and lean mass, ignores fat distribution, and fails to capture metabolic health status.” A University of Florida editorial in Frontiers in Medicine found that BMI alone leads to “significant misidentification of patient health risk classification.”
Consider the muscular adult classified as “overweight” despite low fat and excellent health, versus the sedentary adult with a “normal” BMI hiding dangerous visceral fat. This is why the 2025 AACE consensus now recommends DXA or impedance plethysmography when BMI and clinical findings disagree. This is not an attack on BMI. It is a limitation that body composition measurement was built to address.
The Hidden Risk: Metabolically Obese Normal Weight (MONW)
The MONW phenotype, sometimes called “skinny fat,” describes people with a normal or low BMI but high visceral fat and low muscle mass. They carry real cardiometabolic risk that BMI screening completely misses.
Normal weight does not mean metabolically healthy. Visceral fat drives insulin resistance, dyslipidemia, and systemic inflammation regardless of what the scale reads. VAT secretes pro-inflammatory cytokines and adipokines that directly impair insulin signaling and cardiovascular function. The metabolic score for visceral fat (METS-VF) has been independently associated with type 2 diabetes, cardiovascular events, and cerebrovascular events. What makes MONW particularly dangerous is that these individuals are rarely flagged for intervention, so the dysfunction goes undetected. It is the clearest argument for using body composition, not BMI, as the screening tool for metabolic risk.
Sarcopenic Obesity: When “Healthy Weight” Becomes a Misleading Label
Sarcopenic obesity is the simultaneous presence of excess fat and reduced skeletal muscle, a combination worse than either condition alone. A 2025 Diabetes Care paper estimated it affects 28.3% of people over age 60 and consistently links to worse physical function, lower quality of life, and higher mortality.
A person can hold a “normal” BMI while losing muscle and gaining fat, a process that accelerates with age, hormonal change, and inactivity. The consequences are real: lower resting metabolic rate, greater insulin resistance, impaired function, and higher fall and fracture risk. Because lean muscle can fall by nearly 50% between ages 20 and 90, and because that loss is masked on the scale by concurrent fat gain, monitoring becomes essential in midlife. A 2026 Nature Medicine paper further noted that GLP-1 medications can reduce both fat and muscle during weight loss, making baseline and ongoing body composition monitoring critical to ensure fat-predominant outcomes.
Why Body Composition Ratios, Not Total Weight, Determine Metabolic Risk
The unified argument is straightforward: it is not how much a person weighs but what that weight is made of, and in what proportions, that determines risk.
The fat mass index (FMI) and lean mass index (LMI) are more clinically meaningful than BMI, both significantly associated with metabolic and cardiovascular outcomes across all BMI categories. The highest-risk phenotype is high visceral fat combined with low lean mass, regardless of total weight. As a 2024 Nutrients paper from Peking University put it, body composition “not only reflects an individual’s nutritional status but also serves as a primary site for metabolic activity.” Monitoring is shifting from optional to standard of care across cardiology, endocrinology, and geriatrics. At Red Mountain, more than 30 years of longitudinal monitoring means these patterns have been observed in real patients over decades, not just in research.
How Body Composition Is Measured Clinically
What matters most is what the numbers mean, not just how the technology works.
DXA: The Clinical Gold Standard
DXA uses a three-compartment model, measuring bone mineral content, fat mass, and lean mass separately with high precision. It can also identify regional fat distribution, including visceral fat area, making it the most clinically complete picture available. The 2025 AACE consensus specifically recommends DXA when BMI and clinical findings disagree.
BIA: The Accessible Clinical Alternative
Bioelectrical impedance analysis (BIA) is the scalable, accessible alternative used widely in clinical practices and medical-grade monitors. It measures electrical resistance through tissues to estimate fat mass, lean mass, and total body water. Medical-grade BIA, unlike a consumer bathroom scale, provides clinically useful data. Its readings can be affected by hydration, recent exercise, and meal timing, which is why consistent, supervised measurement protocols matter.
What “Healthy” Body Composition Actually Looks Like
Healthy body composition is a range, not a single number. Men aged 20 to 39 typically fall between 8 and 19% body fat; women fall between 21 and 32%. Both ranges widen with age.
Crucially, healthy composition includes adequate lean mass, not just low fat. A very low body fat percentage without sufficient muscle is not a health goal. The essential fat floor of roughly 3% for men and 12% for women must be respected, as going below it impairs hormone production, immune function, and reproductive health. The objective is the optimal ratio of lean to fat mass for metabolic function and longevity. Total body water within normal ranges (roughly 55 to 65% for men and 45 to 60% for women, varying by age) is a positive indicator of lean mass quality.
Body Composition in the Era of GLP-1 Weight Loss Medications
GLP-1 medications have created new urgency around body composition monitoring, because these medications can reduce both fat and muscle during weight loss. A 2026 Nature Medicine paper documented the unintended risk of sarcopenic obesity during weight-loss interventions in older adults.
This is why baseline body composition assessment, before starting any program, is clinically essential. Without knowing the starting ratio of fat to lean mass, it is impossible to determine whether weight is coming from the right compartment. Ongoing monitoring is the tool that helps ensure fat-predominant rather than muscle-predominant loss. This is central to Red Mountain’s clinical model: programs designed to minimize side effects, preserve muscle mass, and maintain nutrient balance, with body composition monitoring built into that support structure. Medication is a tool; structure and clinical guidance are the solution.
Why Red Mountain Monitors Body Composition, Not Just Weight
At Red Mountain, weight loss is understood as the beginning of metabolic work, not the end of it. Body composition monitoring is what separates a meaningful outcome from a misleading one.
More than 30 years of real-world patient outcomes have shown, firsthand, how the same number on the scale can represent entirely different metabolic realities. Monitoring fits across the practice’s care architecture: from initial metabolic assessment in the Foundation stage, through muscle preservation during active weight loss in the Function stage, to long-term monitoring in the Longevity stage — a framework explored in depth in Dr. Kim’s overview of the 6 stages of weight loss and weight management. An in-person, clinician-led model, rather than an app-only one, allows the kind of longitudinal tracking that produces meaningful data over time. This is context, not promotion; it is simply what clinical body composition monitoring looks like in practice.
Conclusion: The Number on the Scale Is Not the Whole Story
Body composition, the ratio of fat mass, lean mass, bone, and water, is the clinically meaningful measure of metabolic health, not total weight or BMI.
Three insights carry the whole argument. First, BMI is metabolically blind and misclassifies both MONW and sarcopenic obesity. Second, visceral fat and lean mass ratios, not total weight, drive cardiometabolic risk. Third, preserving lean mass during weight loss is as important as losing fat. Clinical practice is shifting body composition assessment from optional to standard of care, and patients and practitioners alike now have the foundation to understand why. For anyone navigating weight, metabolic health, or aging, the goal is not a lower number on the scale but a healthier ratio of what that number is made of.
If You Want to Know What Your Weight Is Actually Made Of
For those who recognize a familiar experience in this article, doing everything right while the scale refuses to tell the whole story, the natural next step is simply getting answers.
Understanding body composition is the starting point for any meaningful metabolic health decision. Red Mountain offers body composition assessment as part of its clinical evaluation. Clinicians provide a detailed picture of what a patient’s weight is actually made of, covering the full context rather than a single number. It is not a commitment, just a conversation. For anyone who wants clarity rather than another number, that conversation is usually where it begins.